Free AI Infographic Maker — Turn Data into Visual Stories (2026)
Create infographics with AI free — turn stats/data into shareable visuals for social media, blogs, presentations. Canva, Piktochart steps.
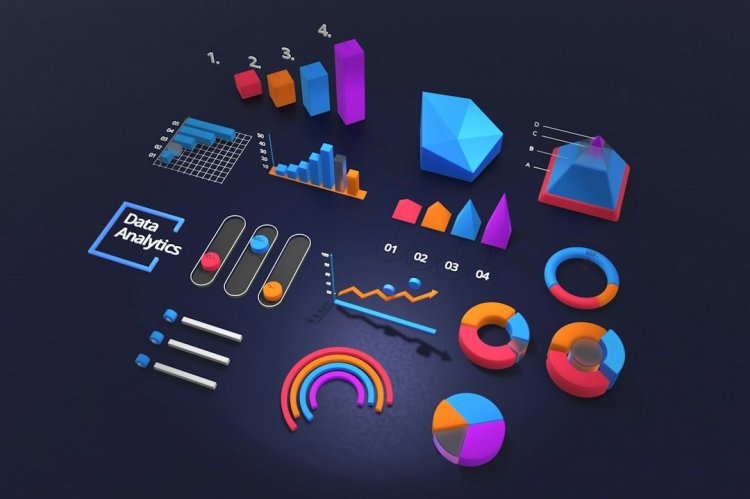
Infographics get shared 3x more than text posts — but making them used to need a designer. AI tools turn your data/text into visuals in minutes.
Free AI Infographic Tools
| Tool | Free | Best For |
| Canva | Free | Templates + AI assist |
| Piktochart AI | Free limited | Purpose-built infographics |
| Venngage | Free limited | Business infographics |
| Microsoft Designer | Free | Quick AI designs |
| Napkin AI | Free | Text → diagrams/charts |
Step 1 — Have Your Content Ready
Infographics need a structure — pick a type:
- List — "Top 10 tips", "7 ways to..."
- Stats — numbers/comparisons with charts
- Process — step-by-step flow
- Comparison — vs, before/after
- Timeline — history/schedule
Step 2 — Use Piktochart AI
- piktochart.com → free account
- Paste your text/content
- AI structures it into an infographic automatically
- Pick a style → customize → download
Step 3 — Canva Method (More Control)
- Search "Infographic" templates
- Pick one matching your data type
- Replace content with yours
- AI assists — Magic Write for text, auto-layout
- Download PNG/PDF free
Step 4 — Napkin AI (For Diagrams)
Brilliant for turning text into diagrams:
- Paste your text/process
- It generates visual diagrams — flowcharts, mind maps, processes
- Export — drop into posts/presentations
Content for Infographics
Ask AI to structure it:
Turn this article into infographic content — pick the top
5 points, make each a short headline + one line. Format for
a list infographic.
What Makes a Good Infographic
- ✅ One clear topic — don't cram everything
- ✅ Big readable numbers/headlines
- ✅ Logical flow (top to bottom)
- ✅ Consistent colors/fonts
- ✅ Charts for data, icons for concepts
- ❌ Too much text — it's a visual, not an essay
Use Cases
- ???? Blog post summaries → shareable graphics
- ???? Statistics/data → engaging visuals
- ???? Process guides → step-by-step visuals
- ???? Social content → higher engagement than text
FAQ
Which is easiest? Canva — pick a template, swap in your content, done. Piktochart AI auto-generates from text.
Can I make them for free? Yes — Canva and Piktochart free tiers make downloadable infographics.
For Pinterest/blog traffic? Infographics are Pinterest gold — tall (2:3 or 1:2) designs get pinned and drive traffic.
Bottom Line
Piktochart AI auto-generates from your text; Canva for template + customization. One piece of data → a shareable visual that gets 3x the engagement of text.
What's Your Reaction?